Integrated Simulation and Visualization
MyM is an integrated environment for the development, visualization and application of simulations of dynamic systems.
MyM comprises a mathematical formalism, a simulator that solves the equations and handles data management and a graphical interface to define input scenarios, to inspect model results and to document and present the model itself.
No programmer needed
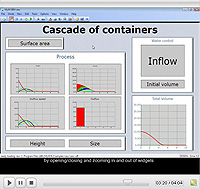
Without the help of a programmer, large simulations with easy-to-use graphical interfaces can be built. You just have to write down the mathematical equations and you can build a graphical user interface yourself by just drawing graphs and charts on a canvas.
When you are done designing, you can distribute your model with the graphical user interface as a tool to customers or colleagues.
Quick tour
If you want to get an idea of what MyM can do and how it can be used to create, visualize and demonstrate a simple simulation model, the best way to learn more is to read the Getting Started manual
Suitable for large dynamic models
MyM is being used by an increasing number of teams of scientists to develop national and global models of public health and the environment, such as IVM and TARGETS. MyM is also successfully used to build user interfaces for existing models such as IMAGE 2.1.
Models built with MyM
- FAIR — Climate policy framework
- IMAGE USS — User Support System
- Phoenix — Population scenarios
- Dimitri — Techno-economic scenarios
- TARGETS — Sustainability model
- GISMO — Global Integrated Sustainability
- MiASMA — Health Impact Assessment
- Timer — Energy Regional model
- Safe Landing — Analysis for IMAGE